Last updated: September 16, 2026
Filter your Analytics data by site and compare Inspection metrics
Select Analytics in the sidebar or in More.
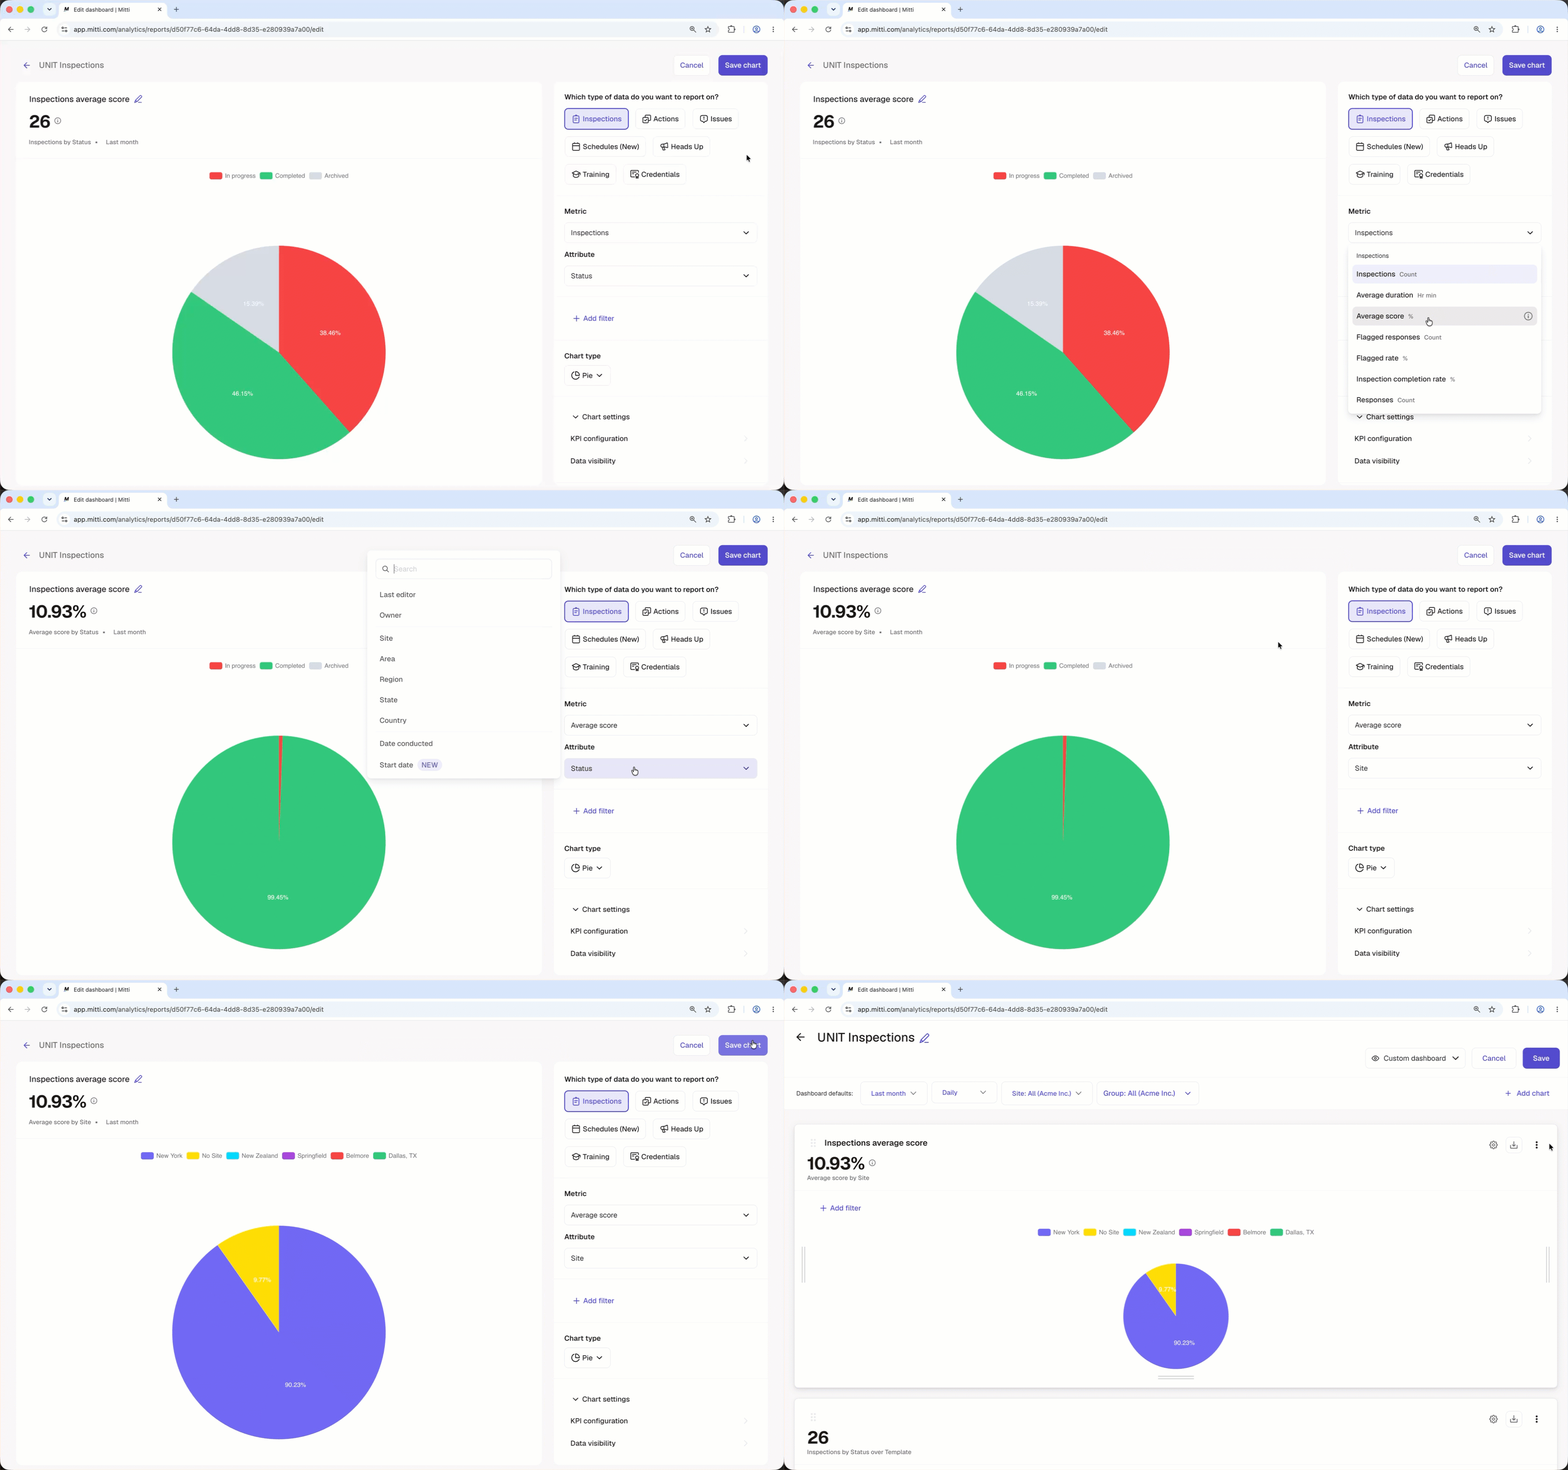
Apply the Site dashboard filter and select the sites you want to compare.
Click Edit on the upper-right corner of the dashboard.
Click on the upper-right corner of the chart you want to work on.
Click the dropdown under Metric and select Average score. If you're building a new chart, click Select metric to add one.
Click the dropdown under Attribute and select Site.
Click Save chart on the upper-right corner of the dashboard.
Repeat for Inspection completion rate, either as a second chart or as the second axis of a dual-axis chart
Send a Heads Up with your findings
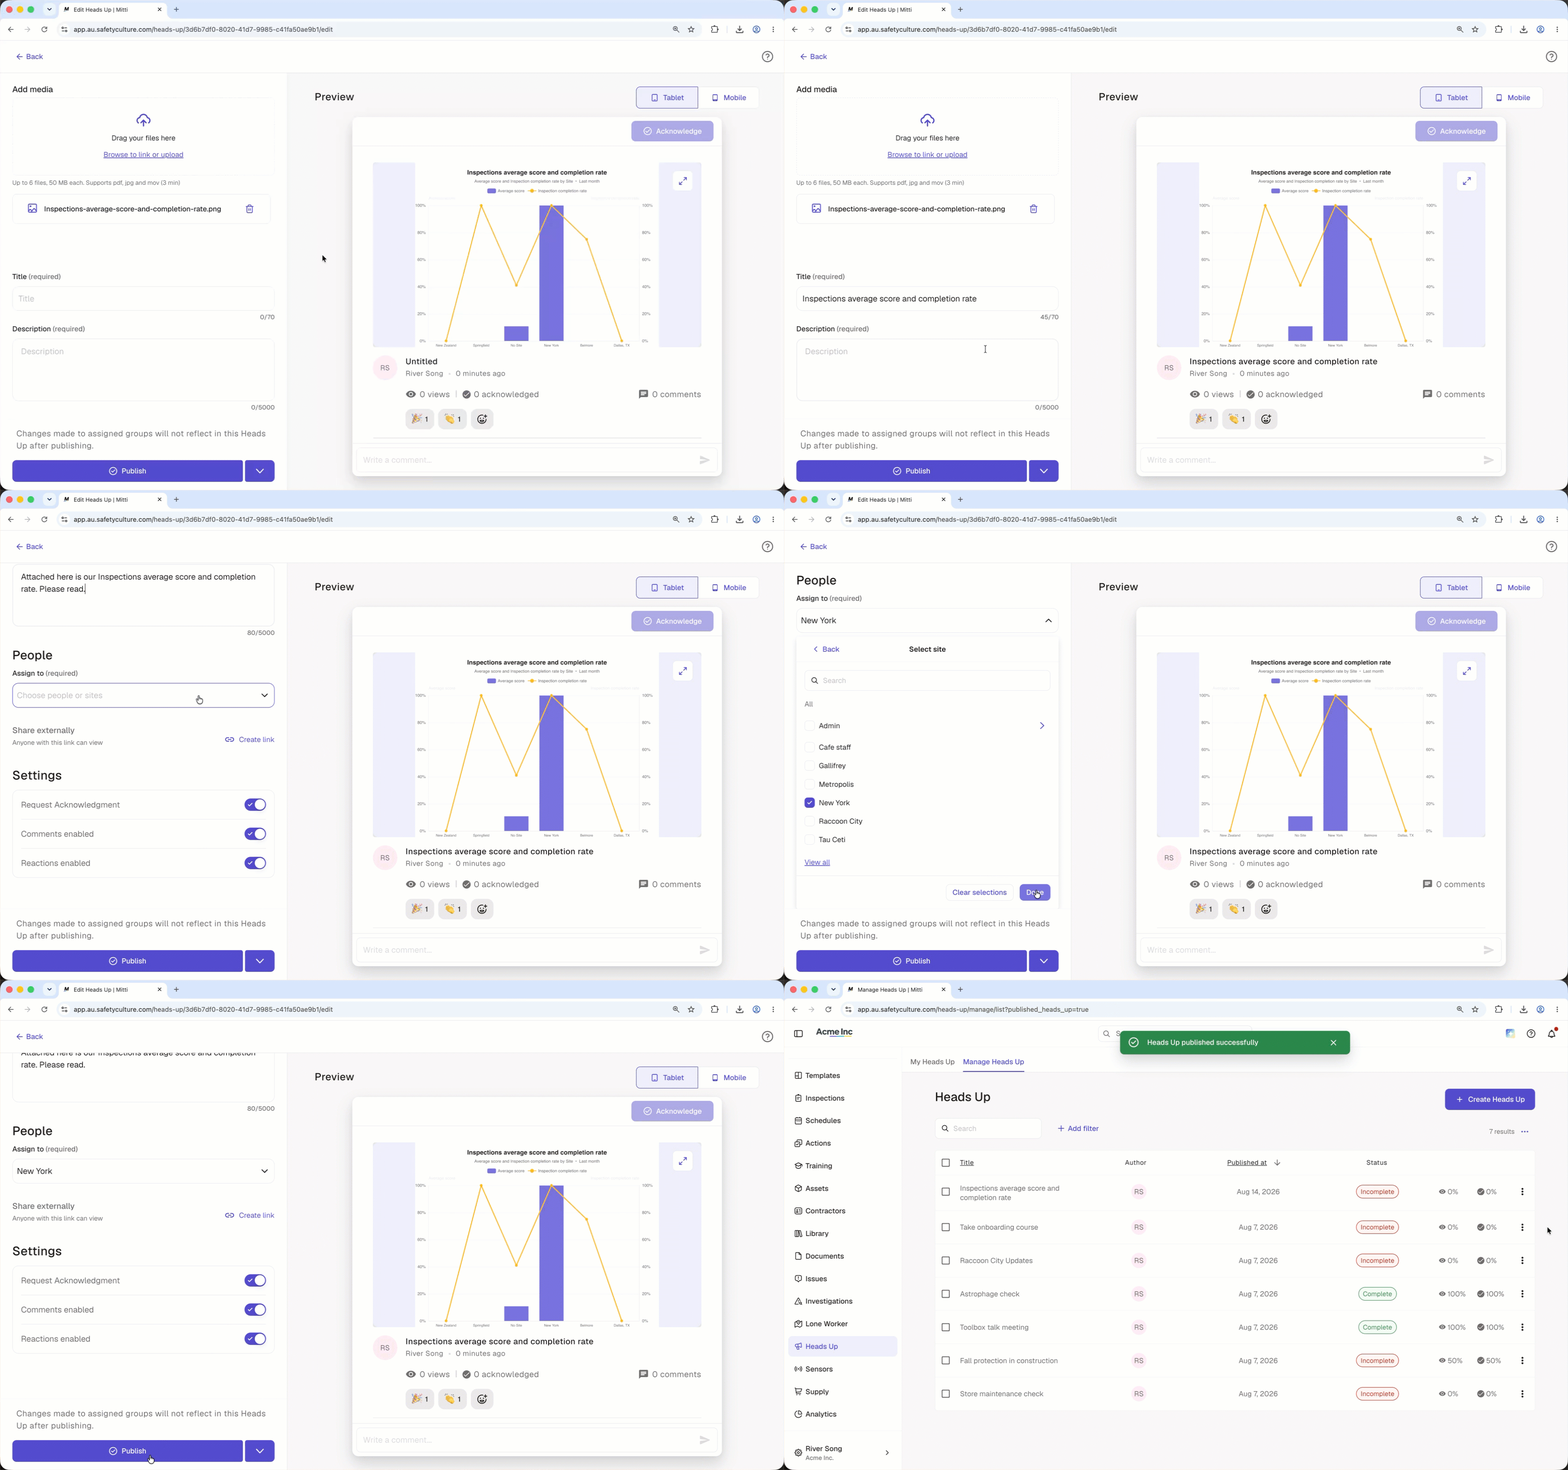
Select Heads Up in the sidebar or in More.
Click Create Heads Up on the upper-right of the page.
Configure the Heads Up accordingly. The preview on the right updates automatically as you add details.
Click Publish on the lower-left of the page.
In the pop-up window, click Publish. If you want to save your Heads Up as a draft and come back to it later, click Back on the upper-left of the page and select Save Draft.
Need more help?
Was this page helpful?