Last updated: July 19, 2026
View a sensor's readings
Click Sensors from the sidebar or in More.
Select Sensors from the tab at the top of the page.
Click the sensor you want to view the readings for.
Select Sensor details.
On the left-hand side, you can select "Temperature", "Humidity", and "Signal strength" depending on the relevant reading needed.
Click the date picker on the right-hand side and select any of the following options:
Past 4 hours
Past 24 hours
Past 7 days
Past 28 days
Custom range
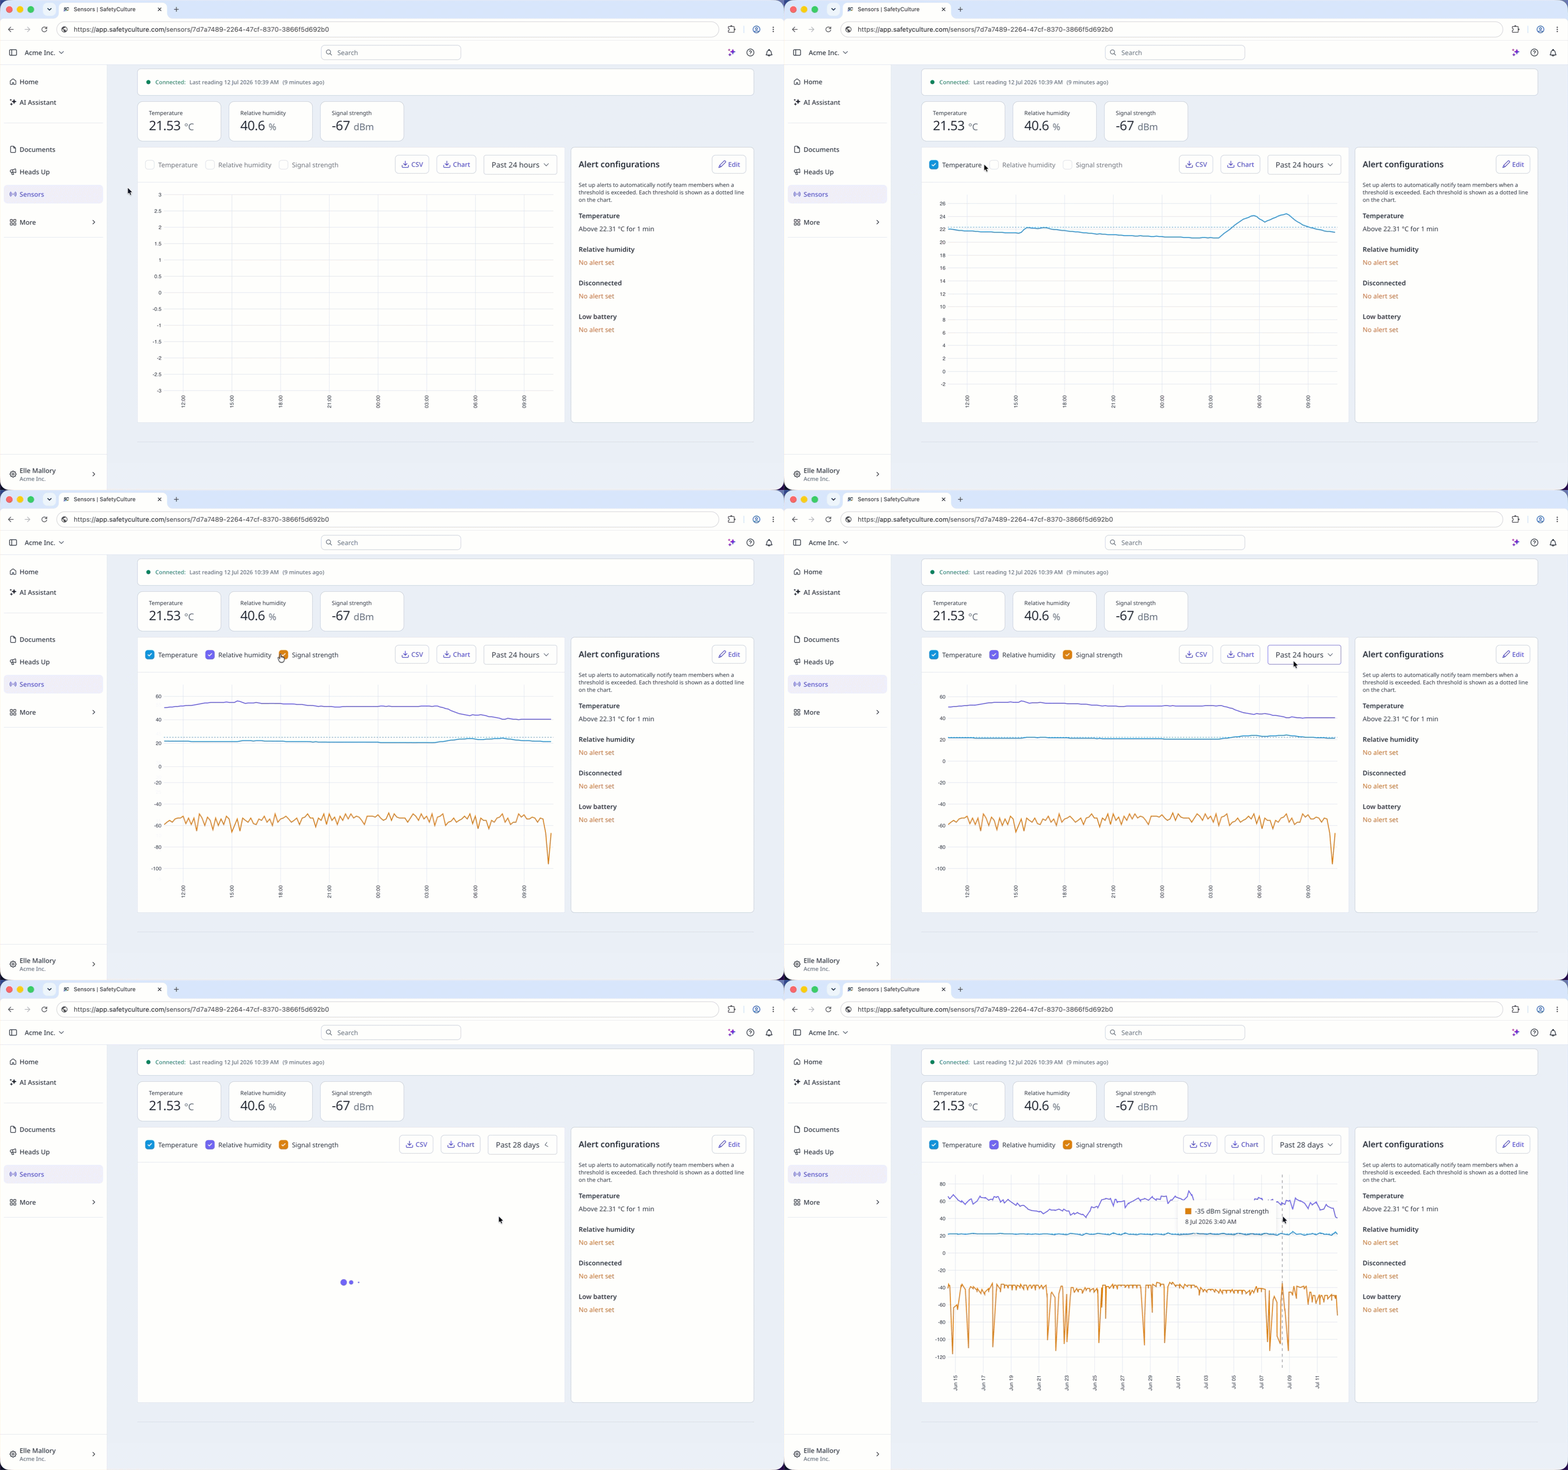
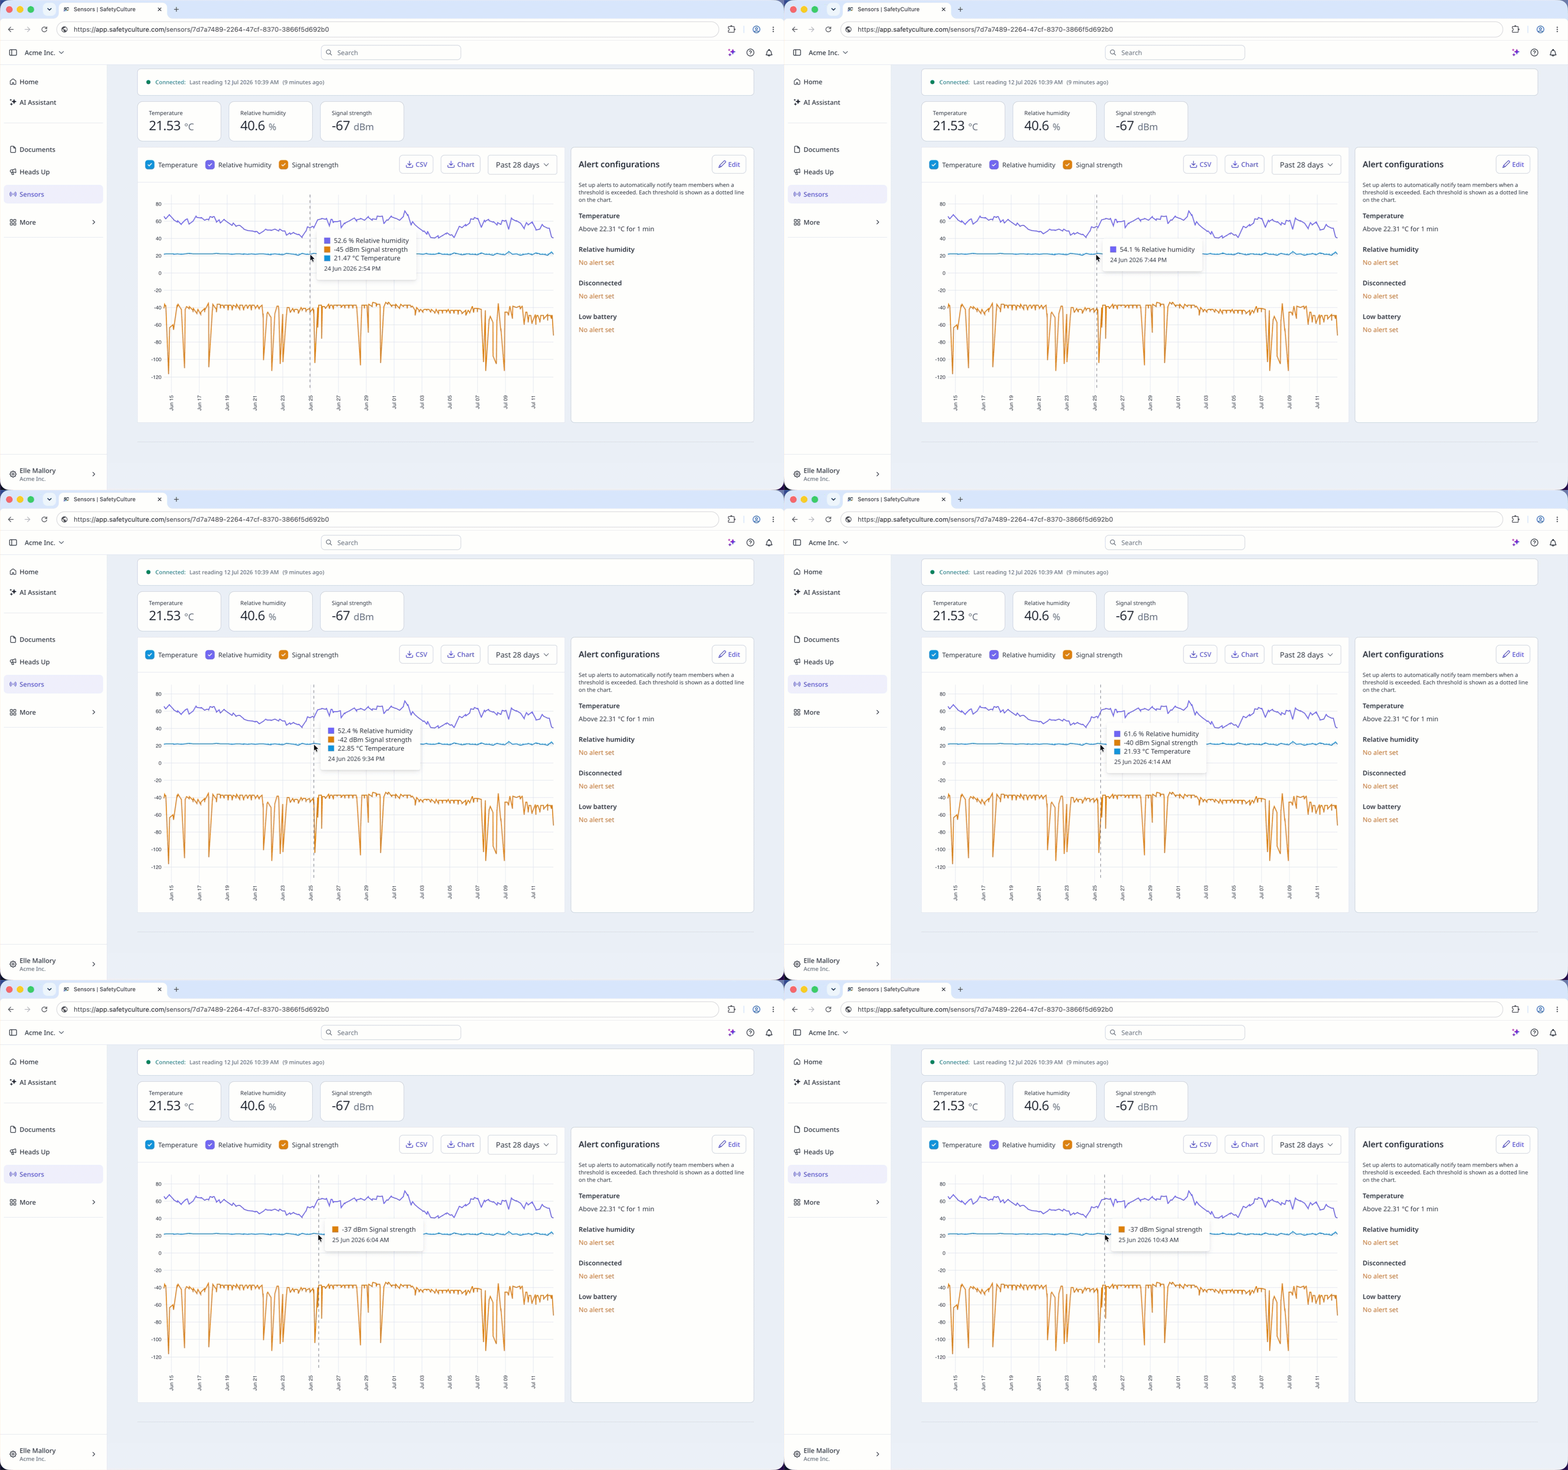
Your graph will display readings based on the selected time period.
For the past 4 or 24 hours, the graph will show the sensor's readings in 10-minute intervals.
For longer time periods, the graph will show the sensor's readings at different intervals to provide a clearer view of the reading's trends.
Open the mobile app.
Tap More at the lower-right corner of your screen.
Select Sensors from the list of options.
Tap Sensors at the top of your screen.
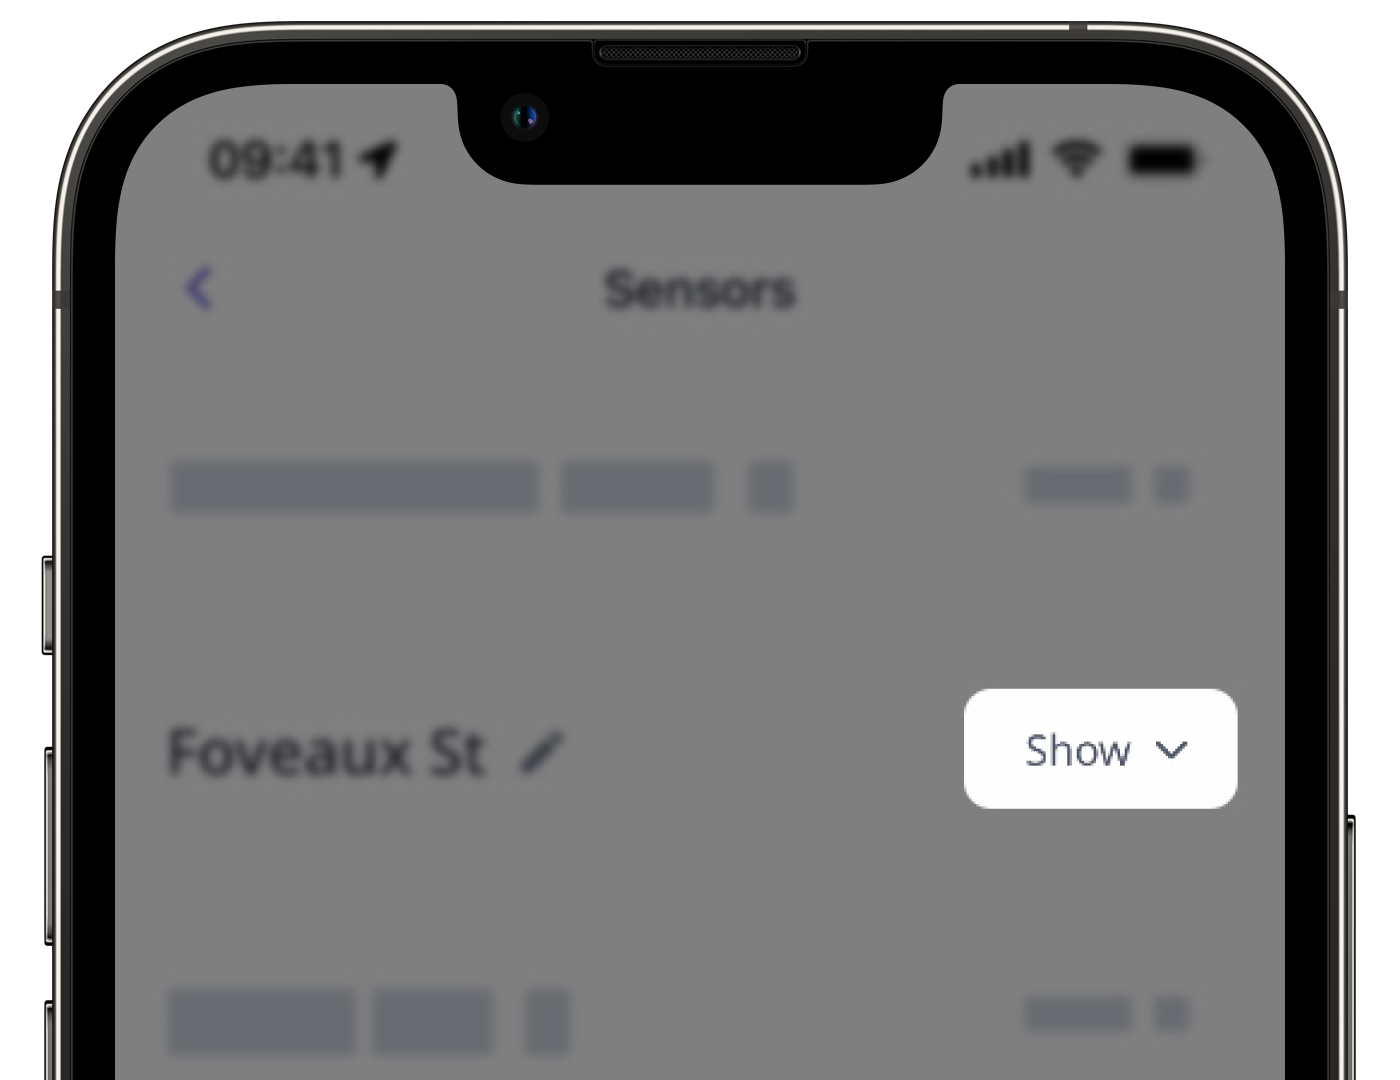
Tap Show at the right side of the sensor's location and select the sensor you want to view the readings for.
Tap Sensor details.
Scroll to the graph section and configure your view accordingly.
You can select "Temperature", "Humidity", and "Signal strength" depending on the relevant reading needed.
Tap the date picker and select any of the following options.
Past 4 hours
Past 24 hours
Past 7 days
Past 28 days
Custom range
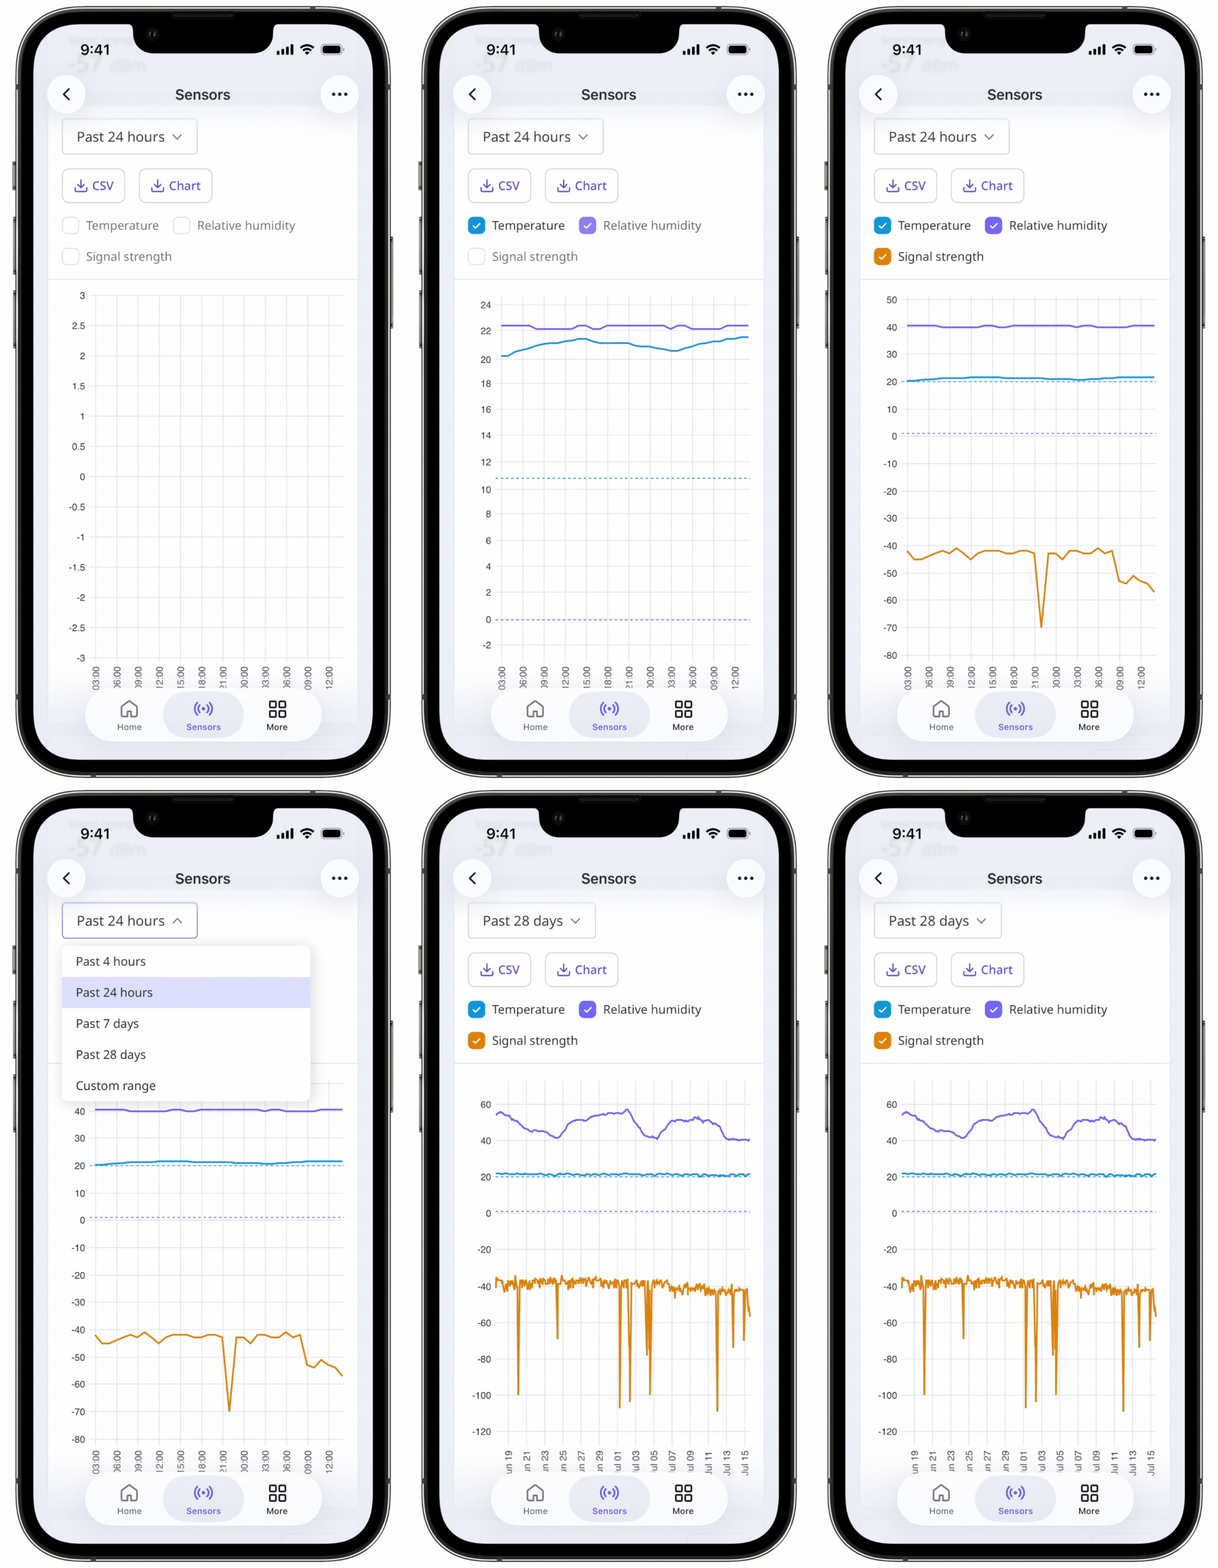
Your graph will display readings based on the selected time period:
For the past 4 or 24 hours, the graph will show the sensor's readings in 10-minute intervals.
For longer time periods, the graph will show the sensor's readings at different intervals to provide a clearer view of the reading's trends.
To access all the sensor readings in 10-minute intervals, download the CSV file of your sensor readings.
Need more help?
Was this page helpful?