Last updated: July 7, 2026
What you'll need
What chart types are available?
Change a chart's type
Select Analytics in the sidebar or in More.
Click on the upper-right corner of the chart.
Click the dropdown under "Chart type" and select the relevant chart type for your data.
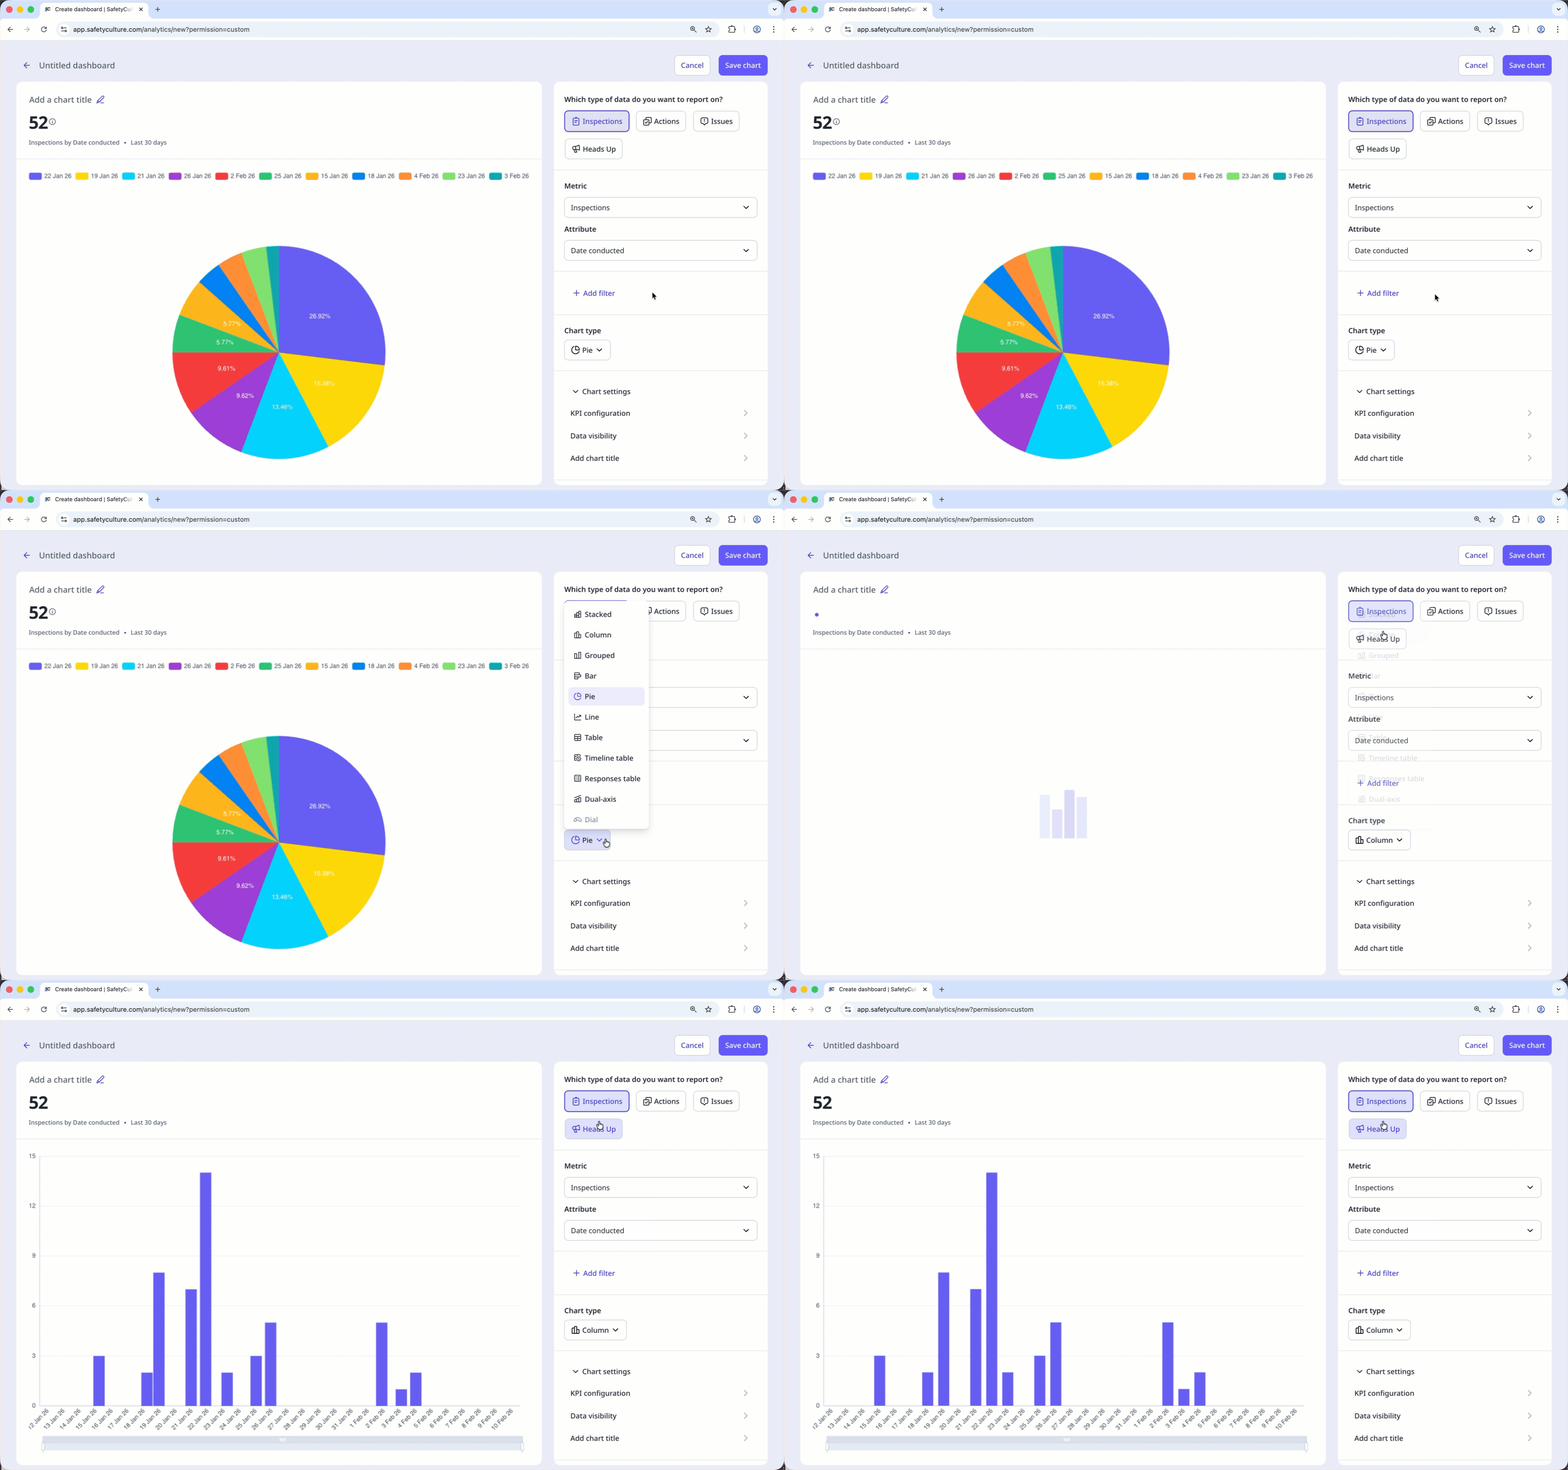
Click Save chart on the upper-right of the page to save the changes to the chart.
Click Save on the upper-right of the page to save the changes to your dashboard.
Need more help?
Was this page helpful?