Zuletzt aktualisiert: 7. Juli 2026
Was Sie brauchen
Welche Diagrammtypen gibt es?
Den Typ eines Diagramms ändern
Select Analysen in the sidebar or in Mehr.
Click on the upper-right corner of the chart.
Click the dropdown under "Chart type" and select the relevant chart type for your data.
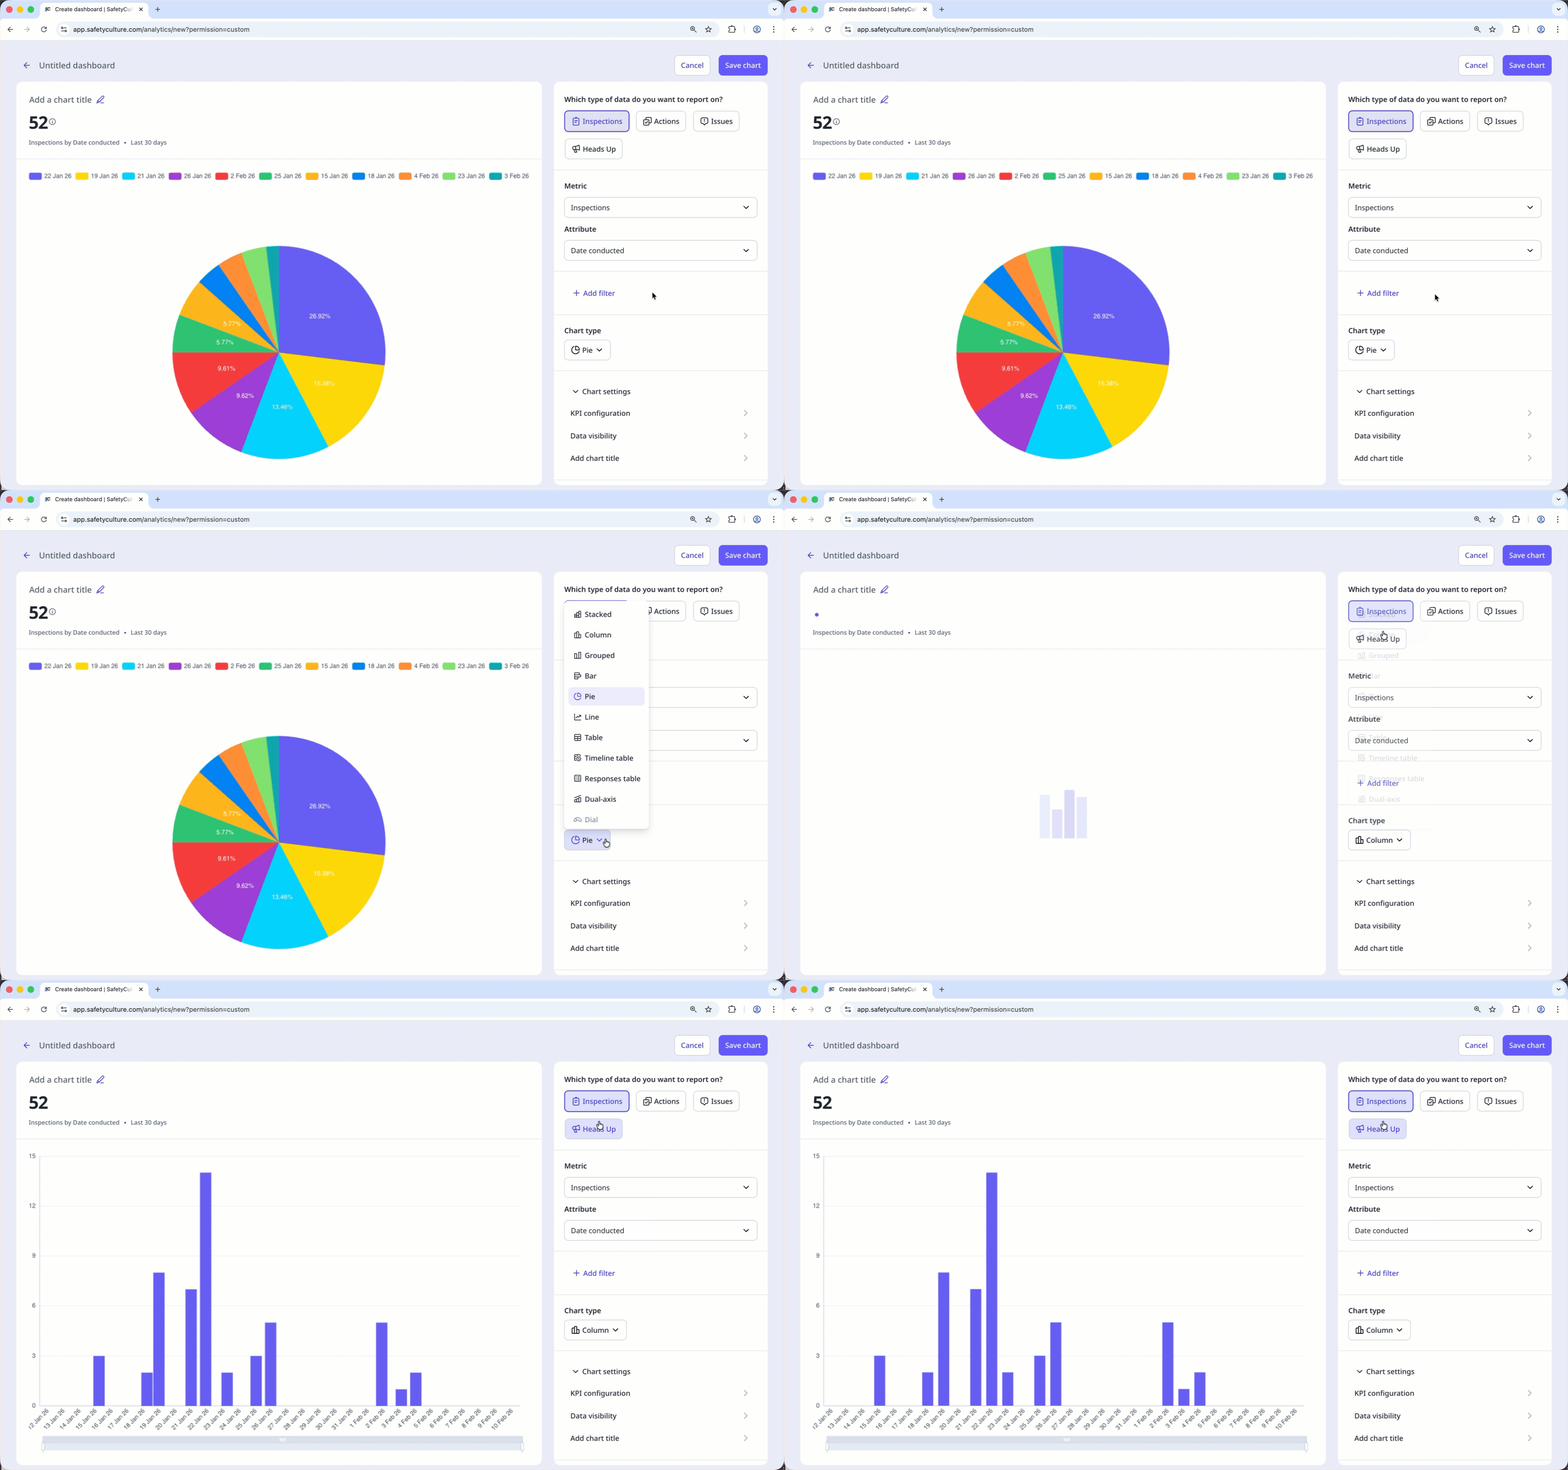
Click Diagramm speichern on the upper-right of the page to save the changes to the chart.
Click Speichern on the upper-right of the page to save the changes to your dashboard.
Brauchen Sie weitere Hilfe?
War diese Seite hilfreich?