Última actualización: 7 de julio de 2026
Lo que necesitarás
¿Qué tipos de gráficos hay disponibles?
Cambiar el tipo de un gráfico
Select Estadísticas in the sidebar or in Más.
Click on the upper-right corner of the chart.
Click the dropdown under "Chart type" and select the relevant chart type for your data.
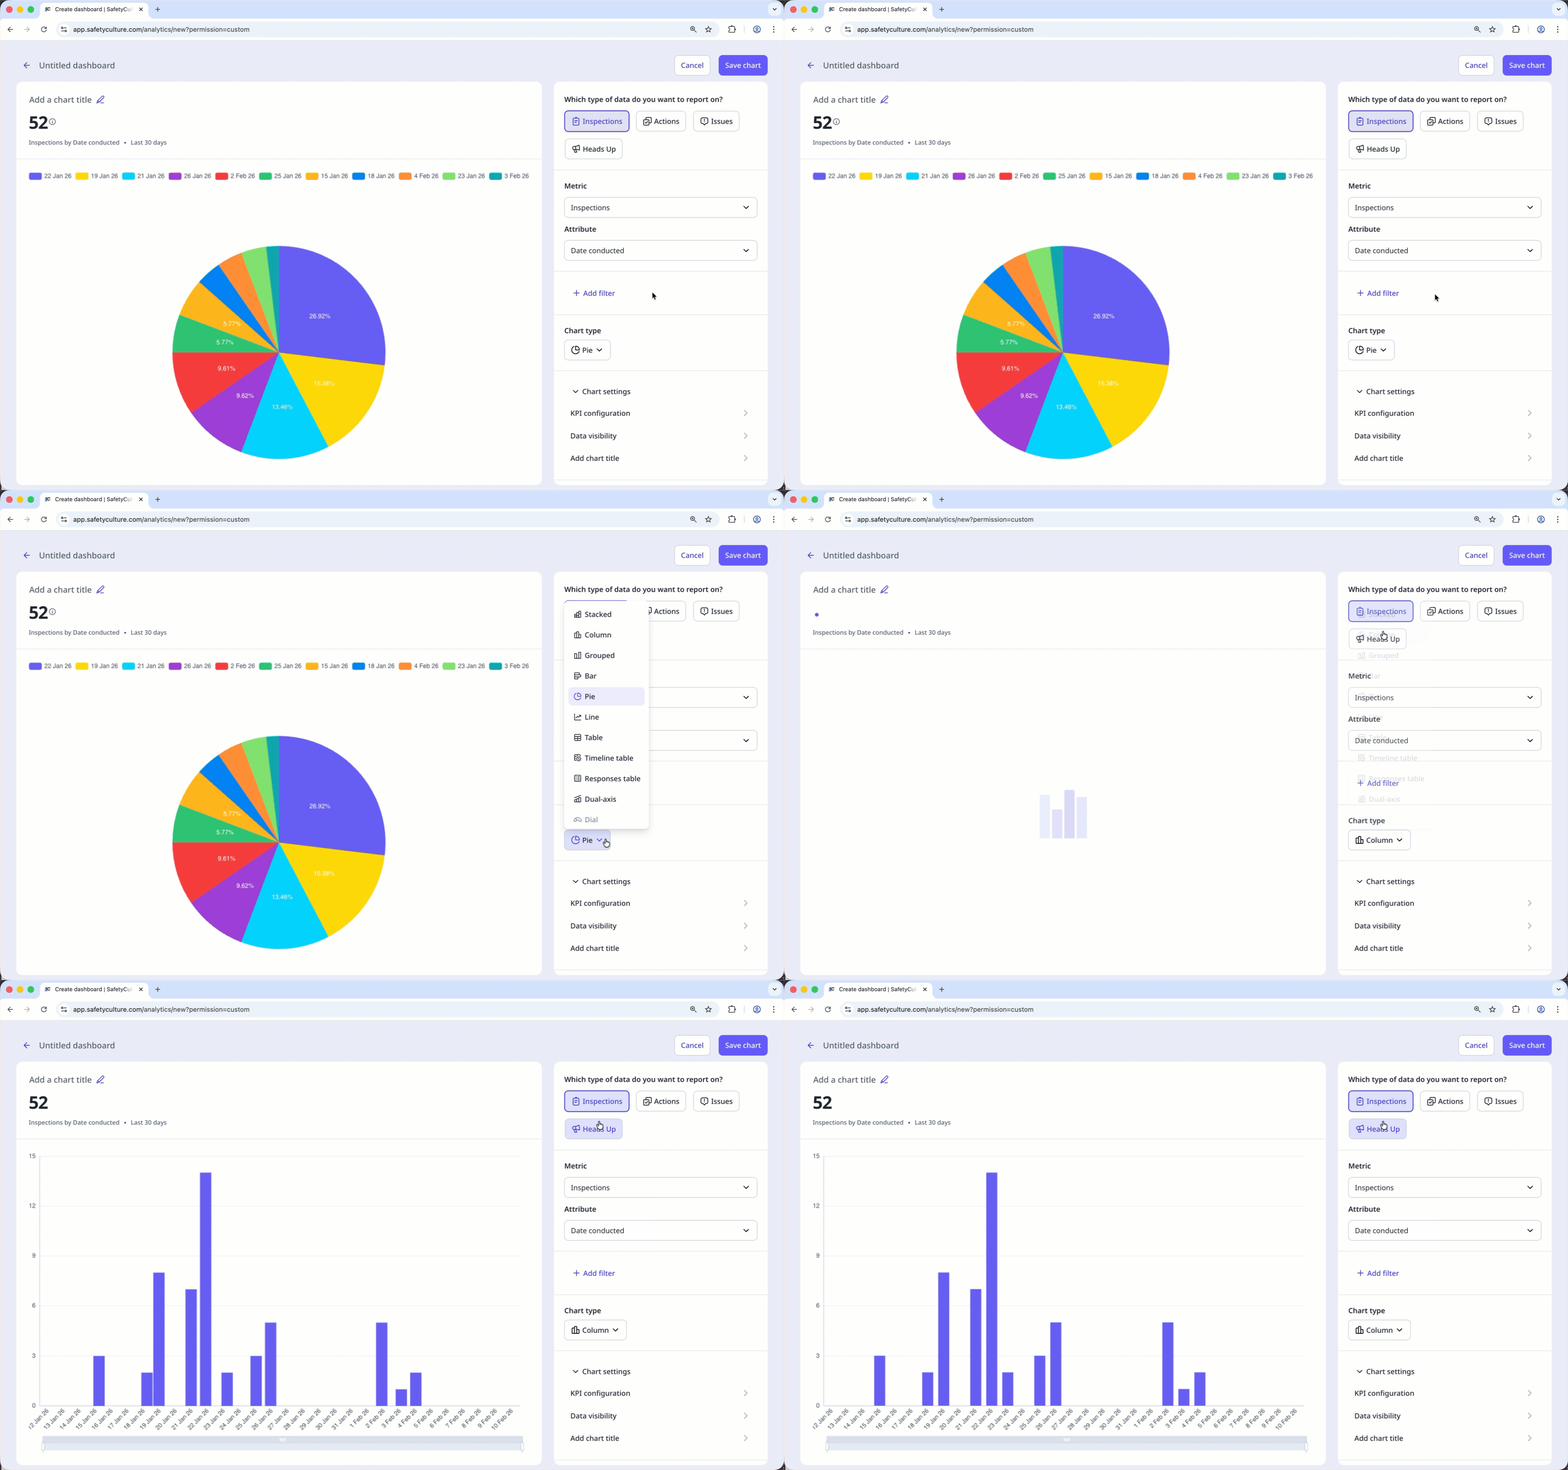
Click Guardar gráfico on the upper-right of the page to save the changes to the chart.
Click Guardar on the upper-right of the page to save the changes to your dashboard.
¿Necesitas más ayuda?
¿Fue útil esta página?