Dernière mise à jour: 7 juillet 2026
Ce dont vous aurez besoin
Quels sont les styles de graphiques disponibles ?
Modifier le type d'un graphique
Select Données analytiques in the sidebar or in Plus.
Click on the upper-right corner of the chart.
Click the dropdown under "Chart type" and select the relevant chart type for your data.
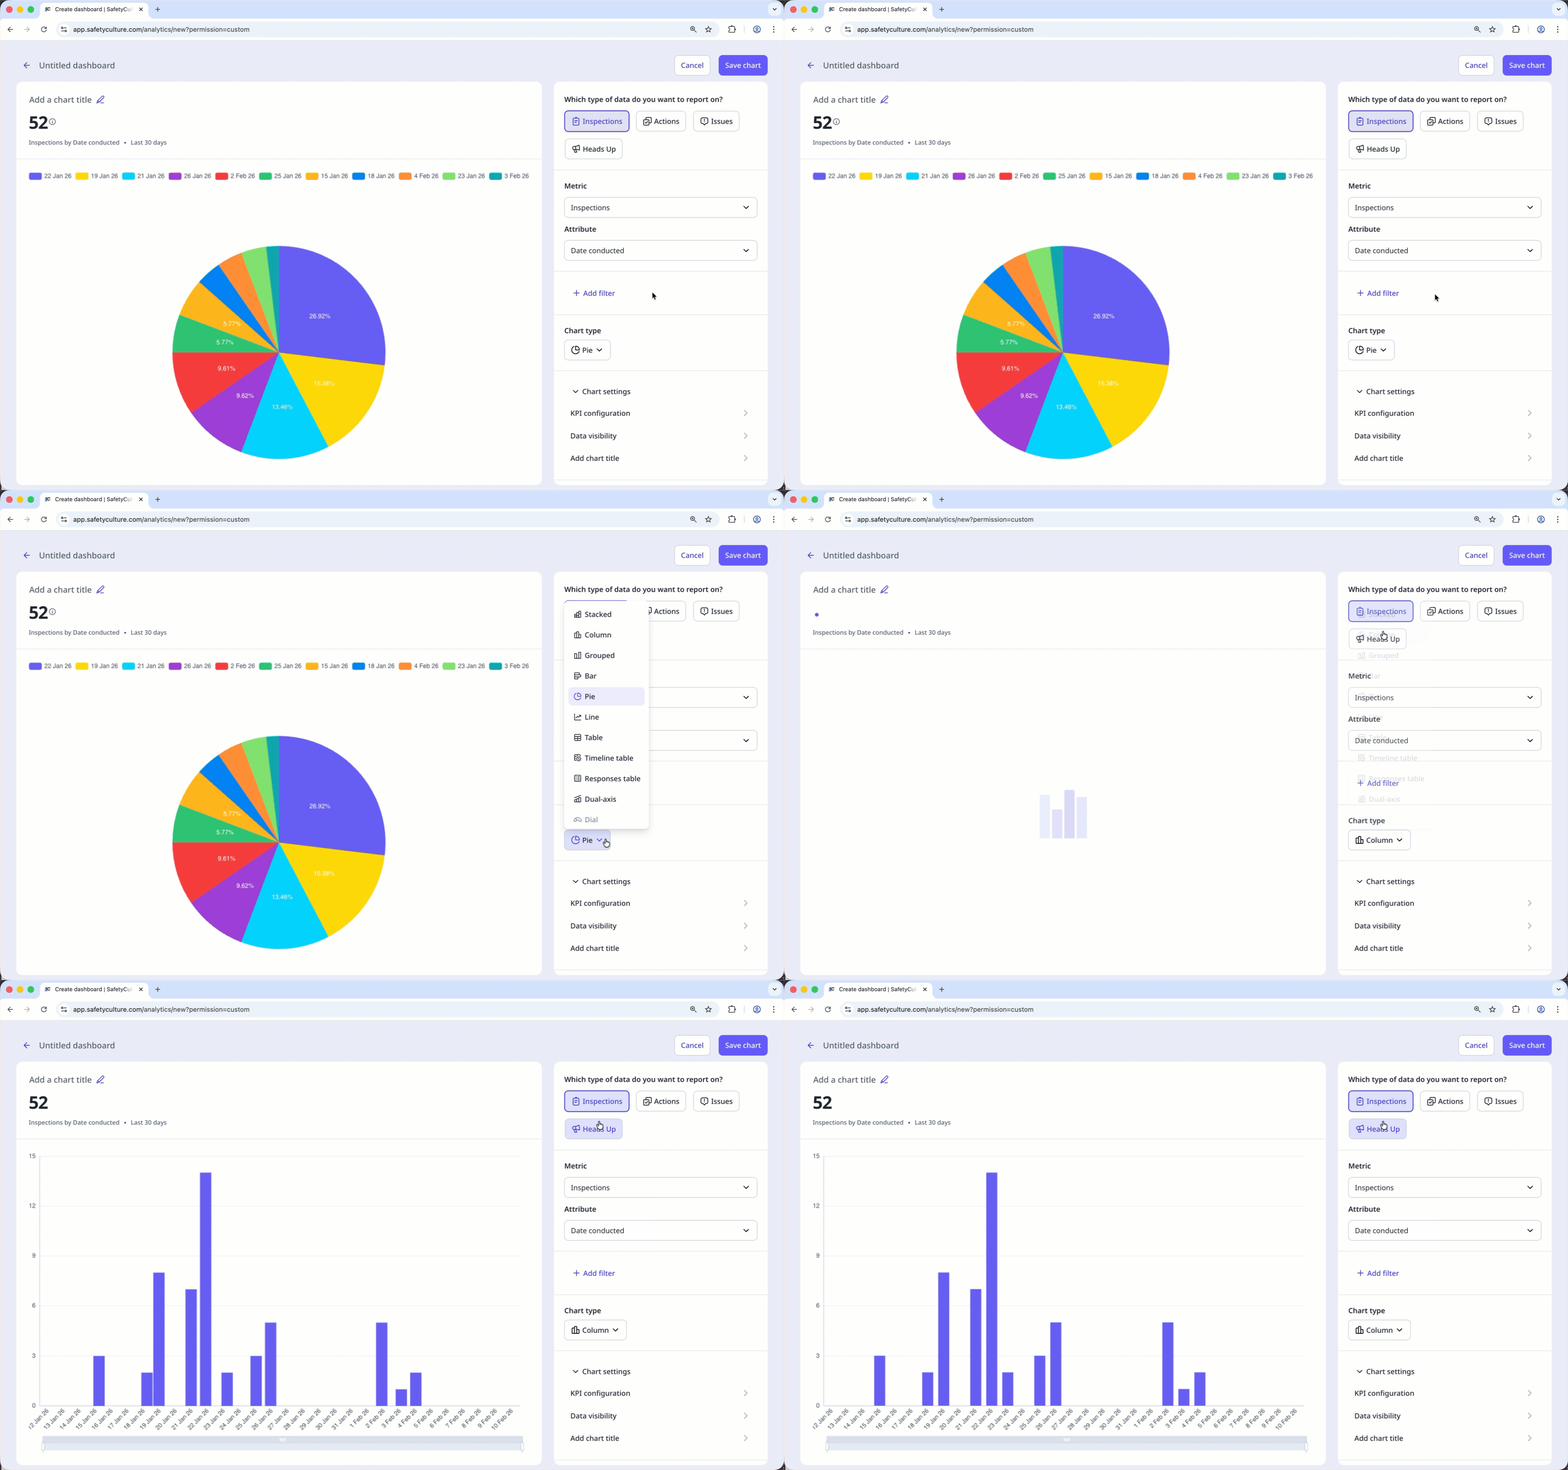
Click Enregistrer le graphique on the upper-right of the page to save the changes to the chart.
Click Enregistrer on the upper-right of the page to save the changes to your dashboard.
Besoin d'aide supplémentaire?
Cette page vous a-t-elle été utile?